Options Trading, Market Maker & Floor Broker Software
Options Trading, Market Maker & Floor Broker SoftwareOptions Trading, Market Maker & Floor Broker SoftwareOptions Trading, Market Maker & Floor Broker Software


The Vol Chart Screen is how many MJT users manage thier volitility updates which can be done manually or dynamically from prestored curves or curves extrapolated from data points in the current markets. The center of the curve can then be auto floated with changes in stock prices and Implied at the money volatilities.

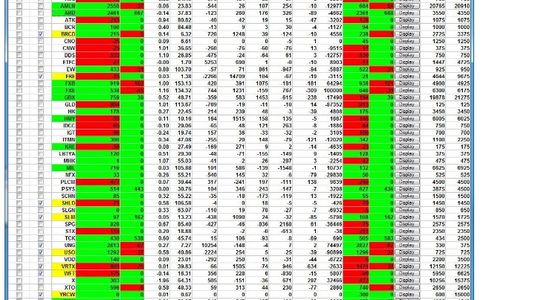
Position information is sumerized and totaled for a quick overview by the trader. This summary includes realtime, profit & loss, delta, gamma, vega theta and rho risk numbers. The traders can also watch real-time haircut, extreme risk and volatility changes for additional compliance with set Market Makers risk boundries. Options Trading.

The Position Greeks detail screen lets you drill down to a much more isolated view of each individual names risk by expiration terms. It also lets the trader view his position for post expiration for risk. Traders can see profit & loss graphs for significant changes in stock price or volatility.
“I have used MJT Software for over 12 years and could not run my Market Making business without it.”
“I appreciate that MJT understands my business and is willing to build new things that will help as the business evolves.”
“MJT is very helpful to me because it allows me to manage many stocks with a limited amount of my attention
“MJT is much simpler for me to do my job than my prior software provider”
“I really Like the MJT Trade Watcher Screen, it lets me see all the trades going on, in away markets and values them against my theoretical”
“I feel if I invest the effort I can get the best theoretical values from my MJT app.”
“MJT is great”
“MJT, not only provides me what I need to run my business, but they are always there to help me be as efficient and successful as I can”.
“MJT enables me to manage numerous stocks with a minimal amount of effort.”